
Punjab State Board PSEB 11th Class Maths Book Solutions Chapter 15 Statistics Ex 15.3 Textbook Exercise Questions and Answers.
PSEB Solutions for Class 11 Maths Chapter 15 Statistics Ex 15.3
Question 1.
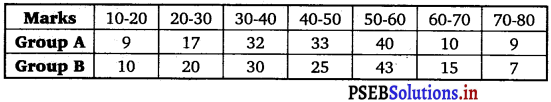
From the data given below state which group is more variable, A or B?
Answer.
For Group A:
Mean, \(\bar{x}\) = A + \(\frac{\sum f_{i} y_{i}}{\sum f_{i}}\) × h
= 45 + \(\frac{-6}{150}\) × 10
= 45 – 0.4 = 44.6
Variance (σ2) = \(\frac{\sum f_{i} y_{i}}{\sum f_{i}}\) [N Σ fi yi2 – (Σ fi yi)2]
= \(\frac{100}{22500}\) [150 × 342 – (- 6)2]
= \(\frac{1}{225}\) [51300 – 36]
= \(\frac{51264}{225}\)
= 227.84
Coefficient of variation (C.V.) = \(\frac{\sigma}{\bar{x}}\) × 100
= \(\frac{15.09}{44.6}\) × 100
= 33.83
For Group B :
Mean, \(\bar{x}\) = A + \(\frac{\sum f_{i} y_{i}}{\sum f_{i}}\) × h
= 45 + \(\frac{-6}{150}\) × 10
= 45 – 0.4 = 44.6
Variance (σ2) = \(\frac{\sum f_{i} y_{i}}{\sum f_{i}}\) [N Σ fi yi2 – (Σ fi yi)2]
= \(\frac{100}{22500}\) [150 × 366 – (- 6)2]
= \(\frac{1}{225}\) (54900 – 36)
= \(\frac{54864}{225}\) = 243.84
∴ σ = 15.61
Coefficient of variation (C.V.) = \(\frac{\sigma}{\bar{x}}\) × 100
= \(\frac{15.61}{44.6}\) × 100 = 35
Coefficient of variation of group B is greater than the coefficient of variation of group A.
Therefore, group B is more variable than group A.
![]()
Question 2.
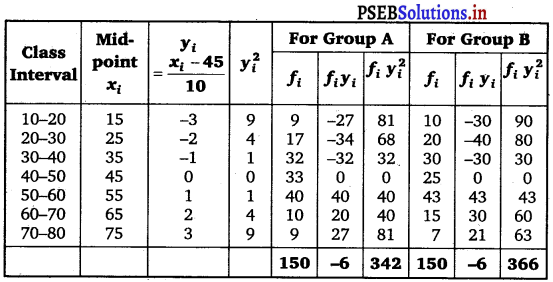
From the prices of shares X and Y below, find out which is more stable in value.
Answer.
For shares X:
For shares Y:
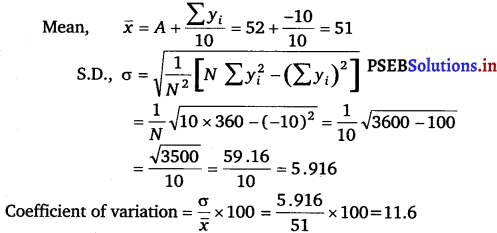
Mean, \(\bar{x}\) = A + \(\frac{\sum y_{i}}{10}\)
= 105 + 0 = 105
S.D., σ = \(\frac{1}{N} \sqrt{N \sum y_{i}^{2}-\left(\sum y_{i}\right)^{2}}\)
= \(\frac{1}{10} \sqrt{10 \times 40-0}=\frac{20}{10}\)
= 0.2
Coefficient of variation (C.V.) = \(\frac{\sigma}{\bar{x}}\) × 100
= \(\frac{2}{105}\) × 100 = 1.9
Coefficient of variation in shares Y is less than the coefficient of variation in shares X.
Therefore, the share Y is more stable than the share X.
![]()
Question 3.
An analysis of monthly wages paid to workers in two firms A and B, belonging to the same industry, gives the following results:
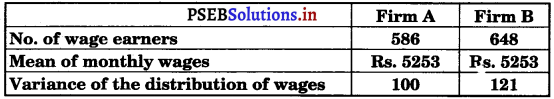
(i) Which firm A or B pays larger amount as monthly wages?
(ii) Which firm, A or B, shows greater variability in individual wages?
Answer.
(i) Monthly wages of firm A = Rs. 5253
Number of wage earners in firm A = 586
∴ Total amount paid = Rs. 5253 × 586
Monthly wages of firm B = Rs. 5253
Number of wage earners in firm B = 648
∴ Total amount paid = Rs. 5253 × 648
Thus, firm B pays the larger amount as monthly wages as the number of wage earners in firm B are more than the number of wage earners in firm A.
(ii) Variance of the distribution of wages in firm A (σ12) = 100
∴ Standard deviation of the distribution of wages in firm
A(σ1) = √100 = 10
Variance of the distibution of wages in firm B(σ22) = 121
∴ Standard deviation of the distribution of wages in firm
B(σ2) = √121 = 11
The mean of monthly wages of both the firms is same i.e., 5253.
Therefore, the firm with greater standard deviation will have more varibility.
Thus, firm B has greater variability in the individual wages.
![]()
Question 4.
The following is the record of goals scored by team A in a football session:
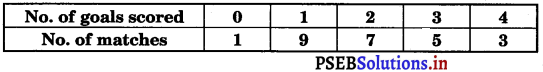
For the team B, mean number of goals scored per match was 2 with a standard deviation 1.25 goals. Find which team may be considered more consistent?
Answer.
Make a table from the given data.
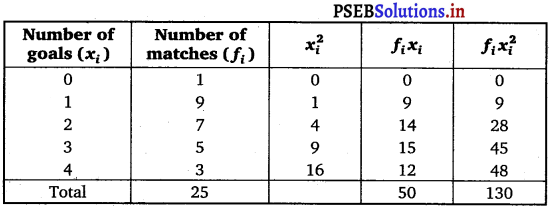
Here, Σfi = 25, Σfixi = 50 and Σ fi xi2 = 130
For team A:
Mean, \(\bar{x}\) = \(\frac{\sum f_{i} x_{i}}{\sum f_{i}}=\frac{50}{25}\) = 2
Standard deviation, σ = \(\frac{1}{N} \sqrt{N \sum f_{i} x_{i}^{2}-\left(\sum f_{i} x_{i}\right)^{2}}\)
= \(\frac{1}{25} \sqrt{25 \times 130-(50)^{2}}\)
= \(\frac{5}{25} \sqrt{130-100}=\frac{\sqrt{30}}{5}\)
= \(\frac{5.477}{5}\)
= 1.095
∴ Coefficient of variation = \(\frac{\sigma}{\bar{x}}\) × 100
= \(\frac{1.095}{2}\) × 100 = 54.75
For team B:
Given, Mean, \(\bar{x}\) = 2 and SD = σ = 1.25
= \(\frac{1.25}{2}\) × 100 = 625
Since, the coefficient of variation of goals of team A is less than that of B.
Therefore, team A is more consistent than team B.
![]()
Question 5.
The sum and sum of squares corresponding to length x (in cm) and weight y (in gm) of 50 plant products are given below:
\(\sum_{i=1}^{50} x_{i}\) = 212, \(\sum_{i=1}^{50} x_{i}^{2}\) = 902.8, \(\sum_{i=1}^{50} \mathbf{y}_{i}\) = 261 \(\sum_{i=1}^{50} y_{i}^{2}\) = 1457.6
which is more varying the length or weight?
Answer.
Given, \(\sum_{i=1}^{50} x_{i}\) = 212, \(\sum_{i=1}^{50} x_{i}^{2}\) = 902.8
Here, N = 50
∴ Mean, \(\bar{x}=\frac{\sum_{i=1}^{50} x_{i}}{N}=\frac{212}{50}\) = 4.24
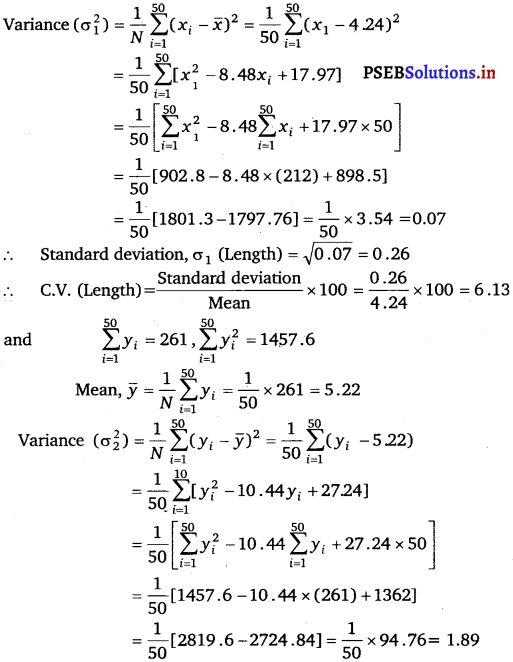
∴ Standard deviation, σ2 (Weight) = √1.89 = 1.37
∴ C.V. (Weight) = Standard deviation / Mean × 100
= \(\frac{1.37}{5.22}\) × 100 = 26.24
Thus, C. V. of weights is greater than the CV. of lengths.
Therefore, weights vary more than the lengths.