Punjab State Board PSEB 6th Class Maths Book Solutions Chapter 14 Data Handling MCQ Questions with Answers.
PSEB 6th Class Maths Chapter 14 Data Handling MCQ Questions
Multiple Choice Questions.
Question 1.
![]()
(a) 30
(b) 40
(c) 50
(d) 5.
Answer:
(c) 50
![]()
Question 2.
![]()
(a) 1
(b) 14
(c) 21
(d) 28.
Answer:
(c) 21
Question 3.
![]()
(a) 6
(b) 1
(c) 5
(d) 8.
Answer:
(b) 1
Question 4.
![]()
(a) 200
(b) 2000
(c) 20
(d) 2.
Answer:
(a) 200
![]()
Question 5.
……….. represents data through picture of objects.
(a) Bar Graph
(b) Histogram
(c) Pictograph
(d) None of these.
Answer:
(c) Pictograph
Question 6.
Which tally marks represents 14?

Answer:
![]()
Question 7.
![]()
(a) 5
(b) 10
(c) 12
(d) 160.
Answer:
(b) 10
Question 8.
……………. is method of representing the data in uniform width size horizontal or vertical box with equal spacing.
(a) Histogram
(b) Bar Graph
(c) Pictograph
(d) Tally Marks.
Answer:
(b) Bar Graph
![]()
Question 9.
A …………… is a collection of numbers gathered to give some information:
(a) Frequency
(b) Data
(c) Tally mark
(d) None of these.
Answer:
(b) Data
Question 10.
If on a scale 1 unit = 200 then how much quantity does 5 units will represent?
(a) 100
(b) 1000
(c) 300
(d) 600.
Answer:
(b) 1000
Question 11.
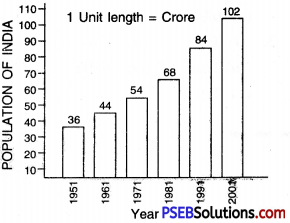
In the adjoining bar graph the growth of population of India from 1951 to 2001 is shown. Observe the graph and find in which two consecutive years the population growth is maximum?

(a) Year 1951 to year 1961
(b) Year 1971 to year 1981.
(c) Year 1981 to year 1991
(d) Year 1991 to year 2001.
Answer:
(d) Year 1991 to year 2001.
![]()
Question 12.
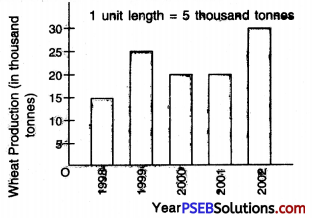
The bar graph given alongside shows the amount of wheat purchased by government during the year 1998-2002. Read the bar graph and find in which year was the wheat production maximum?

(a) 1998
(b) 1999
(c) 2001
(d) 2002.
Answer:
(d) 2002
Question 13.
![]()
(a) 5
(b) 6
(c) 7
(d) 8.
Answer:
(c) 7
Question 14.
![]()
(a) 5
(b) 7
(c) 9
(d) 10.
Answer:
(d) 10
![]()
Question 15.
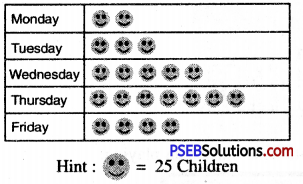
There is a circus in a village. The number of children came to see circus from Monday to Friday are shown by a pictograph. Read the following pictograph carefully and answer the questions below:

How many children came to see circus on Tuesday?
(a) 25
(b) 50
(c) 75
(d) 100.
Answer:
(c) 75
Fill in the blanks:
Question (i)
![]()
Answer:
Seven
Question (ii)
A data is a collection of …………… gathered to give some information.
Answer:
Numbers
![]()
Question (iii)
A diagram that represents stastieal data in the form of pictures is called …………….. .
Answer:
pictograph
Question (iv)
The initial step of any investigation is the ……………. of data.
Answer:
collection
Question (v)
The data can be arranged in a ……………. form using tally marks.
Answer:
tabular
![]()
Write True/False:
Question (i)
Pictograph represents the data in form of pictures. (True/False)
Answer:
True
Question (ii)
There are three types of data. (True/False)
Answer:
False
Question (iii)
The primary data is collected directly from of source. (True/False)
Answer:
True
![]()
Question (iv)
![]()
Answer:
False
Question (v)
![]()
Answer:
True
