
Punjab State Board PSEB 6th Class English Book Solutions English Bar Graph Reading Comprehension Exercise Questions and Answers, Notes.
PSEB 6th Class English Bar Graph Reading Comprehension
Bar Graph द्वारा विभिन्न प्रकार के आंकड़ों को दंडों (Bars) की सहायता से दर्शाया जाता है। इससे आंकड़ों को समझना, उनका तुलनात्मक अध्ययन करना, उनकी बढ़ती या घटती प्रवृत्ति (Upwards & Downward trends) की जानकारी प्राप्त करना बहुत ही सरल हो जाता है।
How to Read a Bar Graph?
किसी Bar Graph को पढ़ना बहुत ही सरल है। इसके लिए निम्नलिखित विधि अपनाएं।
1. X-Axis अर्थात् क्षैतिज/लेटवीं (Horizontal) line आंकड़ों से जुड़ी items दर्शाती है।
2. Y-Axis अर्थात् लम्बवत् अथवा खड़ी (Vertical) line उनसे संबंधित आंकड़े बताती है। इस रेखा पर सुविधाजनक ढंग से आंकड़ों का विभाजन दिया होता है।
3. इसे पढ़ने के लिए item पर बने दण्ड के ऊपरी तल को सीधी रेखा द्वारा खड़ी लाइन से जोड़ें। वहां दिया गया आंकड़ा ही उसी item की value बताएगा।
![]()
Some Important Bar Graphs
1. Study the following Bar graphs and write a short paragraph on each about what it informs.
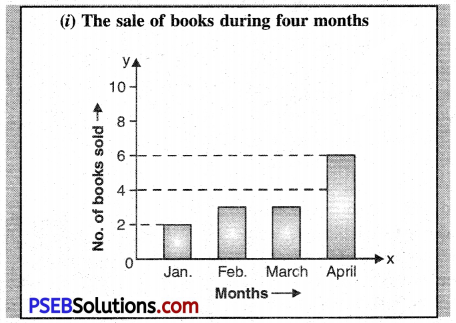
Paragraph – The graph shows the number of books sold during four months. It is from January to April. In January only two books were sold. In Feb, the number increased. It was three. In March too the equal number of books was sold. April recorded the maximum sale. In this month six books were sold. Thus, the total number of books sold during four months was twelve.
(ii) Total Number of Students in a School
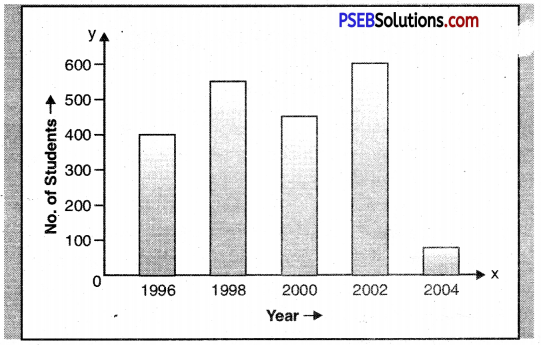
Paragraph – The graph shows the number of students in a school in different years. Their number was maximum (600) in 2002. It was least in 2004 only after two years. It means something must have gone wrong with the school as 500 students left the school.
The school was also popular with the student in 1998 when its strength was 550. Then its strength went on falling for two years. On the whole, the school was a popular one till 2002.
(iii) Number of Corona (Covid-19) Patients in Punjab
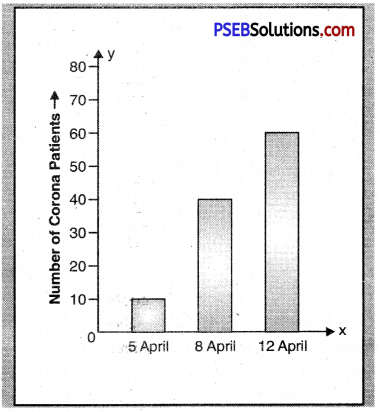
Paragraph – The graph informs us about number of Corona (Covid-19) patients in Punjab. In April 2020, it spread very rapidly. Within a week, from April 5 to April 12 the number of Corona patients became six fold. The most alarming phase was April 5 to April 8 when the number jumped from 10 to 40. After that the spread lost its furry and only 20 more patients were added to it during the next four days. On April 12, the total number of patients was 60. The government is of the view that it was the result of the voilation of safety measures. For safey, people must keep distance and use masks. Above all, they should stay at home.
![]()
(iv) Read the Bar graph and write down a paragraph on it.
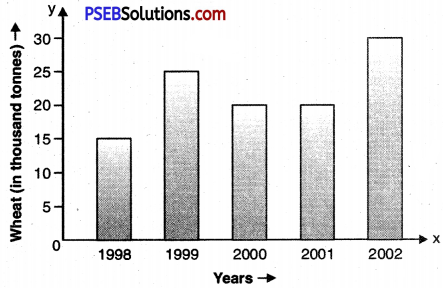
Paragraph – Our government buys wheat from the farmers every year. It is called Buffer stock. It is used in crisis. It is increasing year by year. In 1998 it was only 15 thousand tonnes. It jumped to 25 thousand tonnes next year. During 2002 purchase of wheat was maximum. It also shows the increase in wheat production. The production in 2000 reduced. And, so was the purchase. The next year also saw the same trend of production and purchase.
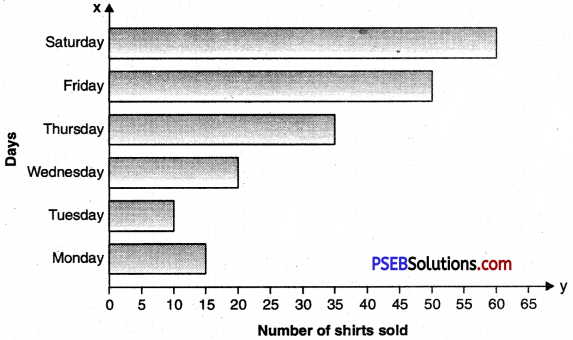
2. Observe this bar graph which is showing the sale of shirts in a ready-made shop from Monday to Saturday.
Now answer the following questions:
(a) What information does the above bar graph give ?
(b) On which day were the maximum number of shirts sold ? How many shirts were sold that day ?
(c) On which day were the minimum number of shirts sold ?
(d) How many shirts were sold on Thursday ?
Answers:
(a) This bar graph tells us the number of shirts sold in a ready-made shop from Monday to Saturday.
(b) On Saturday the maximum number of shirts were sold. Sixty shirts were sold that day.
(c) On Tuesday, the number of shirts sold was the minimum. It was only ten.
(d) On Thursday thirty-five shirts were sold.
The graph also shows the sale went in increasing after Wednesday.
Now write answers in form of a paragraph.
This bar graph tells us the number of shirts sold in a ready made shop from Monday to Saturday. On Saturday, the maximum number of shirts were sold. Sixty shirts were sold on that day. On Tuesday the number of shirts sold was the minimum. It was only ten. On Thursday, thirty five shirts were sold. The graph also shows the sale went in increasing after Wednesday.
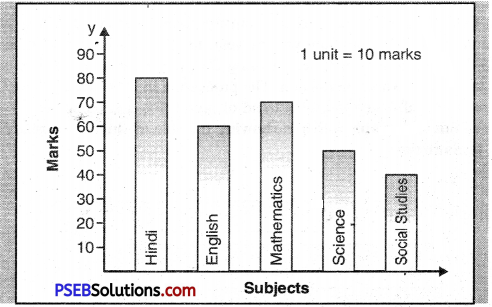
3. Observe this bar graph which shows the marks obtained by Aziz in monthly tests in different subjects.
Answer the given questions:
(a) What information does the bar graph give ?
(b) Name the subject in which Aziz scored maximum marks.
(c) Name the subject in which he has scored minimum marks. (d). State the name of the subjects and marks obtained in each of them.
Answers:
(a) This graph informs us about the marks obtained by Aziz in different subjects in monthly tests.
(b) He scored maximum marks in Hindi. He got 80 marks in this subject.
(c) In Social Studies he scored minimum marks. He obtained only forty marks.
(d) The other subjects were English, Mathematics and Science. In these three subjects he obtained 60,70 and 50 marks respectively
Thus we observe that Aziz is poor in Science and Social Studies.
![]()
Now write these answers in the form of a short paragraph.
This pargraph informs us about the marks obtaied by Aziz-in different subjects in monthly tests. He scored maximum marks in Hindi. He got 80 marks in this subject. In Social Studies, he scored minimum marks. He obtained only forty marks. The other subjects were English, Mathematics and Science. In these three subjects he obtained 60,70 and 50 marks respectively. Thus we observe that Aziz is poor in Science and Social Studies.
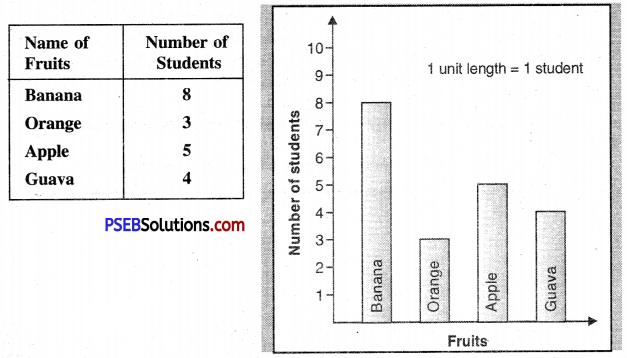
4. Study the following Bar graph and write 7-8 sentences on each about the information it gives. You can also take the help of the given table.
Answer:
(a) The graph tells us about the choice of students for different fruits. The fruits were Banana, Orange, Apple and Guava. Some students made their choice for more than one fruit.
(b) Eight students liked Banana, five students Apple and four students Guava.
(c) Only three students made their choice for orange. As such orange got least number of votes.
(d) Thus Banana was the choice of maximum number of students. Apple and Guava got the second and third position respectively in this choice making contest.
5. Study the given Bar graph carefully and write few sentences on the information it provides.
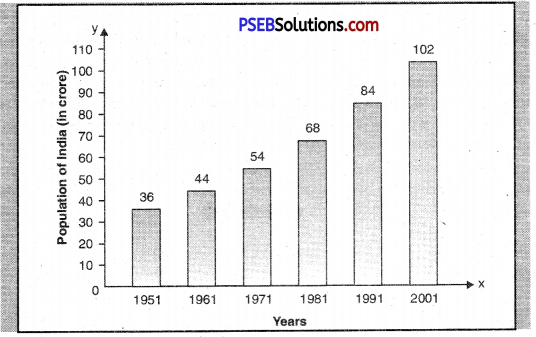
(a) This bar graph shows the population of India in different census years from 1951 to 2001. The census in India takes place every 10 years. (b) We observe that our population is increasing continuously. (Par).
(c) It was only 36 crores in 1951. It touched the figure 102 crores in 2001.
(d) Thus 76 crore people were added to our population in 50 years only.
(e) It was the maximum increase in population between 1991-2001. The period between 1951-1961 saw the minimum addition.
![]()
6. Study the given Bar graph carefully and write a short paragraph on the information it provides.
Runs Scored by a Harmanpreet Kaur in a five O.D.I. matches series.
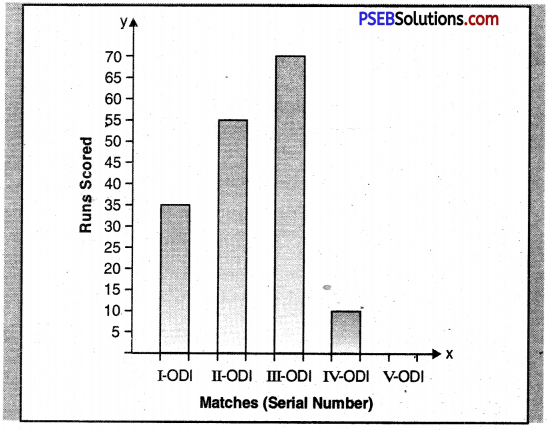
Paragraph – This bar graphs represents the runs scored by Harmanpreet Kaur in five O.D.I. matches. She began with 35 runs in the first match. In the second match she scored 55 runs. She gave her best performance in the third match by scoring 70 runs. Then she lost her nature torch of the game audience. In fourth match she could score only 10 runs. And in the last match. she made no score as she went for a duck. Thus she failed to impress the audience in the last two matches. On the whole, she scored 170 runs in the series.