Punjab State Board PSEB 9th Class Maths Book Solutions Chapter 14 Statistics Ex 14.2 Textbook Exercise Questions and Answers.
PSEB Solutions for Class 9 Maths Chapter 14 Statistics Ex 14.2
Question 1.
The blood groups of 30 students of Class VIII are recorded as follows:
A, B, O, O, AB, O, A, O, B, A, O, B, A, O, O,
A, AB, O, A, A, O, O, AB, B, A, O, B, A, B, O.
Represent this data in the form of a frequency distribution table. Which is the most common, and which is the rarest, blood group among these students ?
Answer:
Frequency distribution table
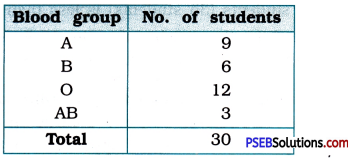
From the frequency distribution table, it is very clear that the most common blood group is O and the rarest blood group is AB.
![]()
Question 2.
The distance (in km) of 40 engineers from their residence to their place of work were found as follows:

Construct a grouped frequency distribution table with class size 5 for the data given above taking the first interval as 0-5 (5 not included). What main features do you observe from this tabular representation?
Answer:
Grouped frequency distribution table
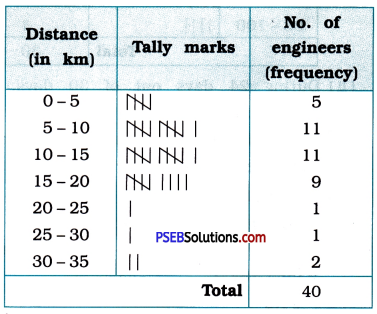
From the frequency distribution table, we can conclude that for the majority of engineers, s i.e., 31 engineers, the distance from their residence to their place to work is 5 km or more than 5 km but less than 20 km. For some engineers, i.e., 5 engineers, this distance is less than 5 km. Still, for some engineers, i.e., 4 engineers, this distance is 20 km or more than 20 km but less than 35 km.
![]()
Question 3.
The relative humidity (in %) of a certain city for a month of 30 days was as follows:

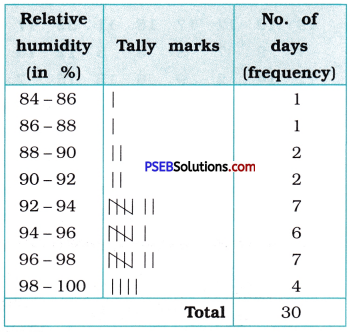
(i) Construct a grouped frequency distribution table with classes 84-86, 86 – 88, etc.
Answer:
(ii) Which month or season do you think this data is about ?
Answer:
During 24 days out of 30 days, the relative humidity is 92 % or more than 92 %. This suggests that the data must have been collected during Monsoon.
(iii) What is the range of this data ?
Answer:
Range of the data
= The greatest observation – The least observation
= 99.2 – 84.9
= 14.3
![]()
Question 4.
The heights of 50 students, measured to the nearest centimetres, have been found to be as follows:
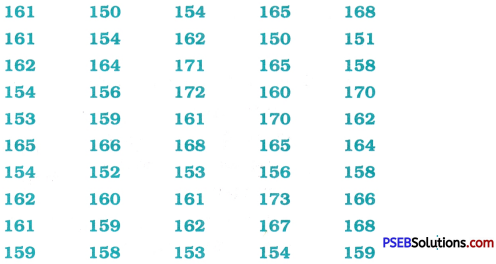
(i) Represent the data given above by grouped frequency distribution table, taking the class intervals as 160 – 165, 165-170, etc.
Answer:
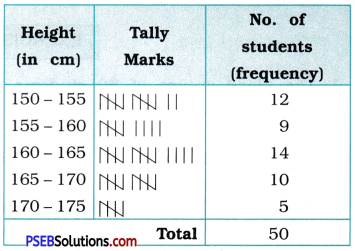
Grouped frequency distribution table
![]()
(ii) What can you conclude about their heights from the table?
Answer:
From the above frequency distribution, we can conclude that the height of 70 % students (35 students) is less than 165 cm while the height of only 10 % students (5 students) is 170 cm or more than that.
Question 5.
A study was conducted to find out the concentration of sulphur dioxide in the air in parts per million (ppm) of a certain city. The data obtained for 30 days is as follows :
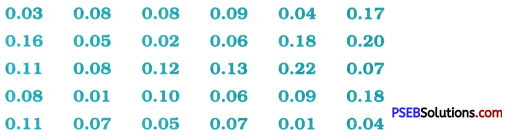
(i) Make a grouped frequency distribution table for this data with class intervals as 0.00-0.04, 0.04-0.08, and so on.
Answer:
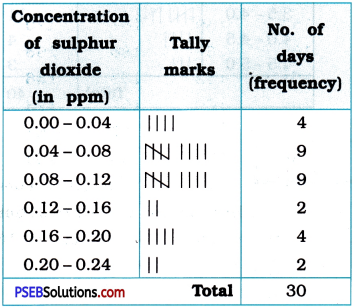
![]()
(ii) For how many days, was the concentration of sulphur dioxide more than 0.11 parts per million?
Answer:
The concentration of sulphur dioxide was more than 0.11 ppm for 8 days (2 + 4 + 2).
Question 6.
Three coins were tossed 30 times simultaneously. Each time the number of heads occurring was noted down as follows:

Prepare a frequency distribution table for the data given above.
Answer:
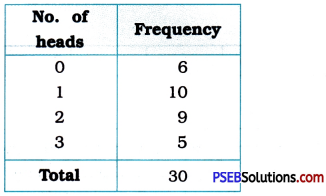
![]()
Question 7.
The value of π up to 50 decimal places is given below:
3.1415926535897932384626433832795028 8419716939937510
(i) Make a frequency distribution of the digits from 0 to 9 after the decimal point.
Answer:
Frequency distribution table
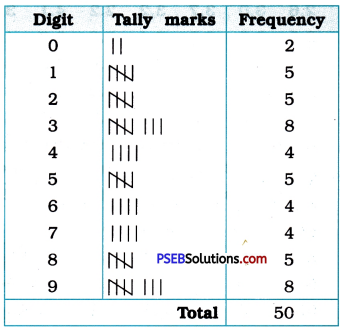
(ii) Which are the most and the least frequently occurring digits?
Answer:
The most frequently occurring digits are 3 and 9 (8 times each) and the least occurring digit is 0 (2 times).
![]()
Question 8.
Thirty children were asked about the number of hours they watched TV programmes in the previous week. The results were found as follows:

(i) Make a grouped frequency distribution table for this data, taking class width 5 and one of the class intervals as 5-10.
Answer:
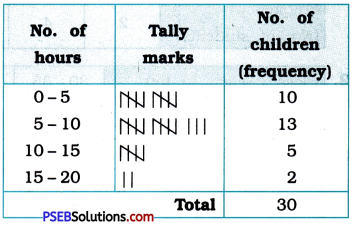
(ii) How many children watched television for 15 or more hours a week?
Answer:
Two children watched television for 15 or more hours a week.
![]()
Question 9.
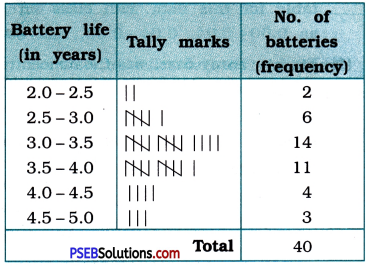
A company manufactures car batteries of a Grouped frequency distribution table particular type. The lives (in years) of 40 such batteries were recorded as follows
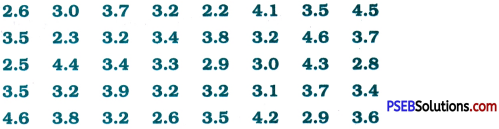
Construct a grouped frequency distribution table for this data, using class intervals of size 0.5 starting from the interval 2 – 2.5.
Answer: